Note
Go to the end to download the full example code.
01. Basic ray tracing#
This example demonstrates two-point ray tracing through a simple 3-layer velocity model using LayTracer in 2D and 3D cases.
Setup#
import laytracer as lt
import numpy as np
import pandas as pd
import matplotlib.pyplot as plt

# sphinx_gallery_thumbnail_number = 2
Define velocity model#
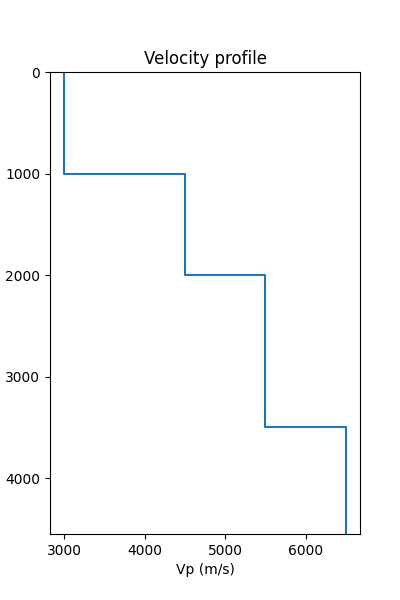
A 3-layer model with increasing velocity with depth.
vel_df = pd.DataFrame({
    "Depth": [0.0, 1000.0, 2000.0, 3500.0],
    "Vp":    [3000.0, 4500.0, 5500.0, 6500.0],
    "Vs":    [1500.0, 2250.0, 2750.0, 3250.0],
    "Rho":   [2200.0, 2500.0, 2700.0, 2900.0],
    "Qp":    [200.0,  400.0,  600.0,  800.0],
    "Qs":    [100.0,  200.0,  300.0,  400.0],
})

print(vel_df)
    Depth      Vp      Vs     Rho     Qp     Qs
0     0.0  3000.0  1500.0  2200.0  200.0  100.0
1  1000.0  4500.0  2250.0  2500.0  400.0  200.0
2  2000.0  5500.0  2750.0  2700.0  600.0  300.0
3  3500.0  6500.0  3250.0  2900.0  800.0  400.0
Plot velocity profile#
ax = lt.plot.velocity_profile(vel_df, param="Vp")
plt.show()
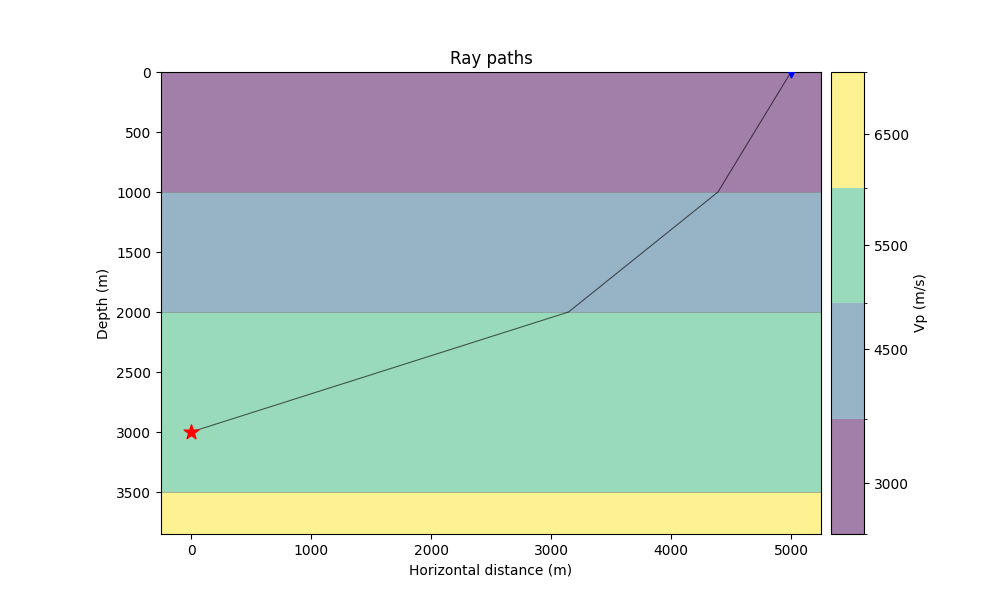
Trace a single ray in 2-D#
Trace a P-wave from a source at depth 3000 m to a receiver at the surface.
stack = lt.build_layer_stack(vel_df, z_src=3000.0, z_rcv=0.0)

# Use trace_rays for 2D tracing as well
res = lt.trace_rays(
    sources=[0.0, 0.0, 3000.0],
    receivers=[5000.0, 0.0, 0.0],
    velocity_df=vel_df,
    source_phase="P",
)

print(f"Travel time:    {res.travel_times[0]:.4f} s")
print(f"Ray parameter:  {res.ray_parameters[0]:.6e} s/m")
Travel time:    1.3453 s
Ray parameter:  1.732757e-04 s/m
Plot the 2-D ray#
Trace multiple rays in 3-D#
Use lt.trace_rays to trace from one source to multiple
receivers arranged in a circle.
src = np.array([0.0, 0.0, 3000.0])

# Receivers on surface in a circle of radius 5000 m
n_rcv = 12
angles = np.linspace(0, 2 * np.pi, n_rcv, endpoint=False)
rcvs = np.column_stack([
    5000.0 * np.cos(angles),
    5000.0 * np.sin(angles),
    np.zeros(n_rcv),
])

result = lt.trace_rays(
    sources=src,
    receivers=rcvs,
    velocity_df=vel_df,
    source_phase="P",
)

print(f"Number of rays: {len(result.rays)}")
print(f"Travel times:   {result.travel_times}")
Number of rays: 12
Travel times:   [1.34534574 1.34534574 1.34534574 1.34534574 1.34534574 1.34534574
 1.34534574 1.34534574 1.34534574 1.34534574 1.34534574 1.34534574]
Plot 3-D rays#
fig = lt.plot.rays_3d(
    vel_df,
    rays=result.rays,
    sources=src,
    receivers=rcvs,
)
fig
Total running time of the script: (0 minutes 0.166 seconds)